We all know OnBase has a lot of moving parts, bells, whistles, shortcuts, timesavers and other features. When it comes to administering a system, especially one you may be new to, it can quickly become overwhelming. Your boss may walk into your office (or call you into a Zoom/Teams meeting now-a-days) and say, “How much are we using OnBase?” Without good data, the answer to this question may not be representative of the reality. As an OnBase System Administrator, you may find yourself asking a lot of questions about how the system is being used.
- How many documents do we bring in each day?
- Are any there any import process batches that need attention?
- How much disk space are we using?
- How much disk space are we going to need going forward?
- Are there any locks (document, process, batch) that need my attention?
- How many licenses are we using?
- How many documents are going through Workflow?
Need to be able to quickly and accurately answer these types of questions? I have the perfect solution for you.
REPORTING DASHBOARDS
Reporting Dashboards is an amazing tool that allows you to not only report on the critical data about the documents in the system but also how the system is running itself!
Through the years we have been asked these same questions by our customers and have worked with them to design Dashboards as an efficient, simple answer. Even internally at Kiriworks we use these reports with our Managed Services customers. Reporting Dashboards allow us to be proactive with their OnBase solution and provide all parties with quick access reports providing all the data and metrics they need.
But Nate, what Data Provider do I use to get this data? I don’t see one already created in the system for these questions?
A lot of this valuable data is not available with the standard Data Providers. You need to create a Custom SQL Query Data Provider.

From there, you will be asked to Edit a SQL query for the data provider to use. In this example, we’re going to determine how much space our disk groups are using.

Nate, that is cool and everything, but I do not know where this data may reside in the OnBase database.
We can help with that! Hyland releases a document called the Database Reporting Guide which provides a ton of valuable information! If you need this document, please reach out to us at [email protected] and we’ll get you the latest and greatest copy.
Awesome! I’ve got my data, but I need it to be presentable to my Manager.
Now that you have your Data Provider, it is time to put it into a pretty format. First, create a Dashboard.

You’ll want to assign that new Data Provider to the Dashboard that you created.

Your Dashboard is almost complete! We’ve linked the data to the dashboard. Now, we have to make it presentable.
For this data, I’d recommend 2 different reports for the dashboard.
- Grid Report
- Pie Chart Report
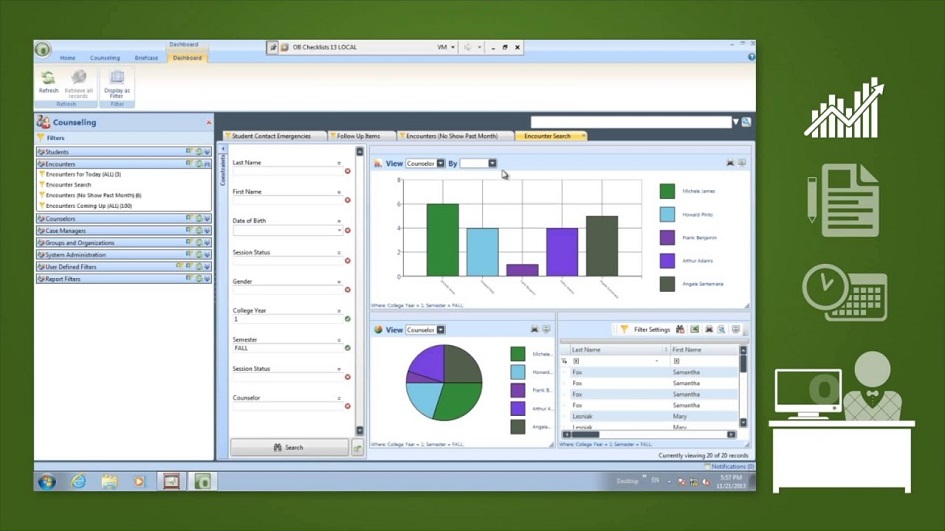
Once you’ve added the reports to the dashboard, assigned your columns and arguments, you should be able to create a Dashboard that looks a lot like this!

Oh my! This is amazing but how do I get this to my boss?
There are multiple ways to provide this report to your boss!
- If your boss is already familiar with OnBase, you can share the dashboard they can look at it without asking you!
- You can Print to a PDF and send it to them via e-mail.
This is just one example of the power of Reporting Dashboards. If you are interested in Reporting Dashboards, reach out to your Account Manager for more information. If you have questions about where the data resides or how to get started, please reach out to the Customer Support Team at [email protected] or chat with us via our Support Portal.